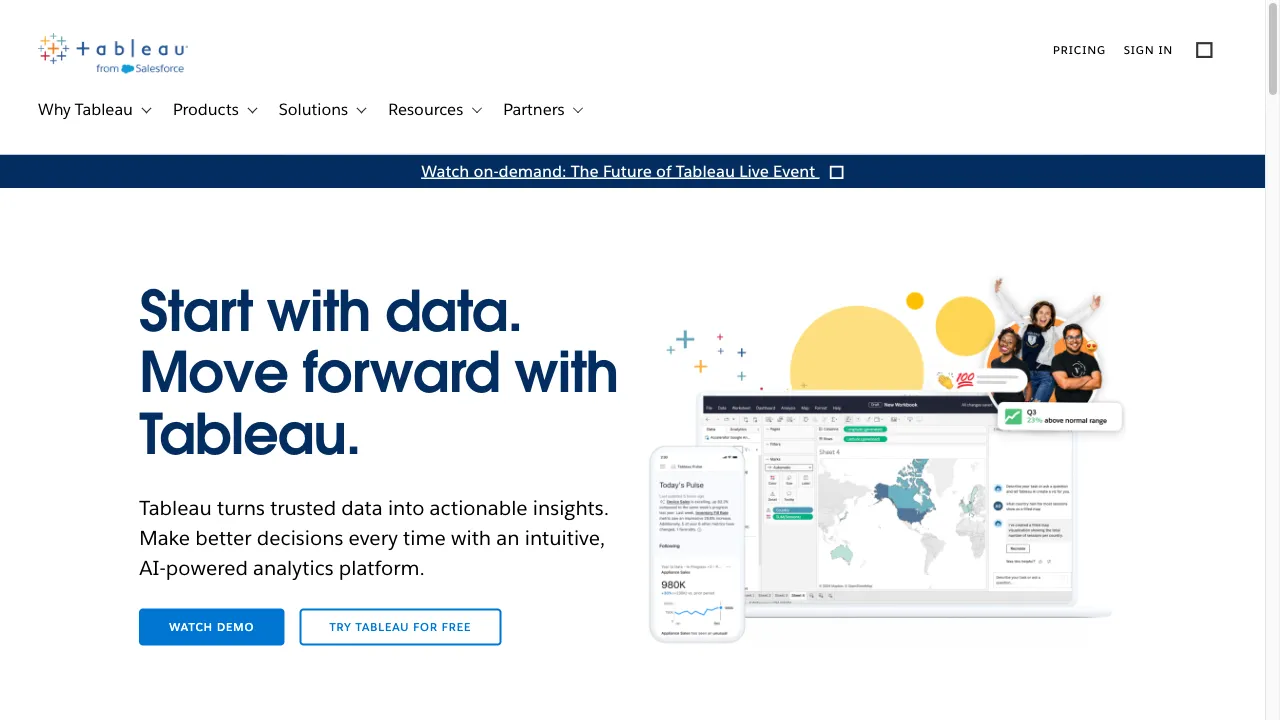
क्या है Tableau?
Tableau is a powerful business intelligence (BI) and data visualization tool that enables organizations to transform raw data into actionable insights. Renowned for its ability to create interactive and shareable dashboards, Tableau connects to a wide range of data sources, including spreadsheets, databases, and cloud services. This versatility allows users to visualize trends, variations, and density of data effectively. With advanced analytics features, collaboration capabilities, and seamless integration with Salesforce, Tableau is widely utilized across industries for various analytical purposes, including sales, finance, healthcare, and human resources. Despite its steep learning curve, Tableau's user-friendly interface makes it accessible to users with varying technical expertise, making it a valuable asset for data-driven decision-making.
Tableau ट्रैफिक एनालिटिक्स
Tableau मासिक विजिट
Tableau शीर्ष विजिट किए गए देश
Tableau शीर्ष कीवर्ड्स
Tableau वेबसाइट ट्रैफिक स्रोत
Tableau विशेषताएँ
Data Connectivity
Tableau supports a variety of data sources, including SQL databases, cloud data warehouses, and spreadsheets, allowing for comprehensive data integration into a single dashboard.
Interactive Dashboards
Users can create visually engaging and interactive dashboards that allow for in-depth data exploration, filtering, and insights.
Advanced Analytics
Tableau includes features like trend lines, forecasting, and statistical summaries, enabling users to conduct sophisticated data analysis without extensive coding.
Collaboration and Sharing
Tableau promotes teamwork by allowing users to share dashboards and reports easily with colleagues, enhancing collaborative data analysis.
Salesforce Integration
Tableau seamlessly integrates with Salesforce CRM, allowing users to utilize CRM data for enriched analytics.
Tableau फायदे
Powerful Visualization
Tableau is highly regarded for its ability to create visually appealing and interactive dashboards. This feature is consistently highlighted in positive user reviews.
Data Integration
The tool's ability to connect to a wide range of data sources is a significant advantage, allowing users to consolidate data from multiple platforms.
User-Friendly Interface
Despite its advanced capabilities, Tableau's drag-and-drop interface makes it accessible to users with varying levels of technical expertise.
Tableau नुकसान
High Cost
One of the most frequently cited drawbacks of Tableau is its high cost, particularly for organizations with many users. The licensing fees can be prohibitive for small to medium-sized businesses.
Steep Learning Curve
While Tableau is user-friendly, mastering its full range of features can be challenging, especially for users who are not tech-savvy.
Limited Customization
Some users have expressed frustration with the limited customization options for visualizations, which can restrict the ability to tailor dashboards to specific needs.
उपयोग कैसे करें Tableau
Step 1: Getting Started with Tableau
To begin using Tableau, download the software from the official Tableau website and install it on your computer. Once installed, open Tableau and connect to a data source. You can choose from various options such as Excel files, SQL databases, or cloud services. After connecting to your data, you can start creating your first visualization by dragging and dropping fields onto the workspace.
Step 2: Creating Your First Dashboard
After creating a few visualizations, you can combine them into a dashboard. Click on the 'Dashboard' tab and drag your visualizations onto the dashboard canvas. You can arrange them as needed and add interactive elements like filters or parameters to allow users to explore the data more effectively.
Step 3: Sharing Your Work
Once your dashboard is complete, you can share it with others. Tableau allows you to publish your dashboard to Tableau Server or Tableau Online, where others can view and interact with your work. You can also export your dashboard as a PDF or image file for offline sharing.
कौन उपयोग कर रहा है Tableau
Sales and Marketing
Organizations use Tableau to analyze sales data, track marketing campaign performance, and forecast future sales trends. The tool's ability to visualize large datasets helps in identifying key sales drivers and market opportunities.
Finance
Financial analysts use Tableau to monitor financial performance, manage budgets, and conduct risk analysis. The tool's advanced analytics capabilities allow for detailed financial modeling and scenario analysis.
Healthcare
In the healthcare sector, Tableau is used to track patient outcomes, manage hospital resources, and analyze clinical data. The tool's interactive dashboards help healthcare providers make data-driven decisions to improve patient care.
टिप्पणियाँ
"Tableau has completely transformed how we visualize our data. The interactive dashboards are a game-changer for our team!"
"While the learning curve was steep, once I got the hang of it, I found Tableau to be incredibly powerful for our analytics needs."
"The cost is a concern for us, but the insights we gain from using Tableau make it worth the investment."
संदर्भ
- [2] Tableau सॉफ्टवेयर समीक्षा: फायदे और नुकसान.URL:https://www.sam-solutions.com/blog/tableau-software-review-pros-and-cons-of-a-bi-solution-for-data-visualization/
- [3] Tableau उपयोग के मामले और डेटा स्रोत.URL:https://help.tableau.com/current/blueprint/en-us/bp_use_cases.htm
- [4] प्रभावी डैशबोर्ड के लिए बेहतरीन प्रथाएँ.URL:https://help.tableau.com/current/pro/desktop/en-us/dashboards_best_practices.htm
- [5] अपने डेटा के साथ काम करने के लिए सुझाव.URL:https://help.tableau.com/current/pro/desktop/en-us/data_tips.htm
Tableau विकल्प
A dynamic online marketplace for business applications.
AI टूल्स का एक व्यापक एग्रीगेटर है जो उत्पादकता के लिए है।
एक शक्तिशाली जावास्क्रिप्ट चार्टिंग लाइब्रेरी इंटरैक्टिव डेटा विज़ुअलाइज़ेशन के लिए।
एक बहुपरकारी सहयोगात्मक प्लेटफार्म टीमों के लिए।
व्यवसायों के लिए एक संपूर्ण ग्राहक सेवा मंच।
AI-powered workplace assistant for productivity.
एक ओपन-सोर्स AI-आधारित प्लेटफॉर्म।
AI-driven platform for unstructured data management.
एक प्रमुख डेटा मार्केटप्लेस जो प्रदाताओं और उपभोक्ताओं को जोड़ता है।
A suite of tools to enhance productivity across sectors.
AI-powered meeting recording and note-taking platform.
एक बिना कोड वाला वेब स्वचालन उपकरण डेटा निष्कर्षण के लिए।
Revolutionary AI tool for spreadsheet management.
एक अभिनव ऑनलाइन स्प्रेडशीट प्लेटफॉर्म सहयोग और विश्लेषण के लिए।
एक AI प्लेटफार्म व्यवसाय स्वचालन और डेटा विश्लेषण के लिए।
AI टूल्स खोजने के लिए एक व्यापक प्लेटफ़ॉर्म।